Exploring MultiSpec
Image Enhancement
In this exercise, you will display an aircraft image of a portion of the Davis Purdue Agriculture Center in Randolf County, Indiana and view the data in several ways using MultiSpec.
Requirements: MultiSpec application and image titled “ag020522_DPAC_cd.lan”., which you can download here.
Open the image if it is not already displayed in a multispectral image window following the guidelines given in exercise 1 (Display and Inspection of Image Data with MultiSpec).
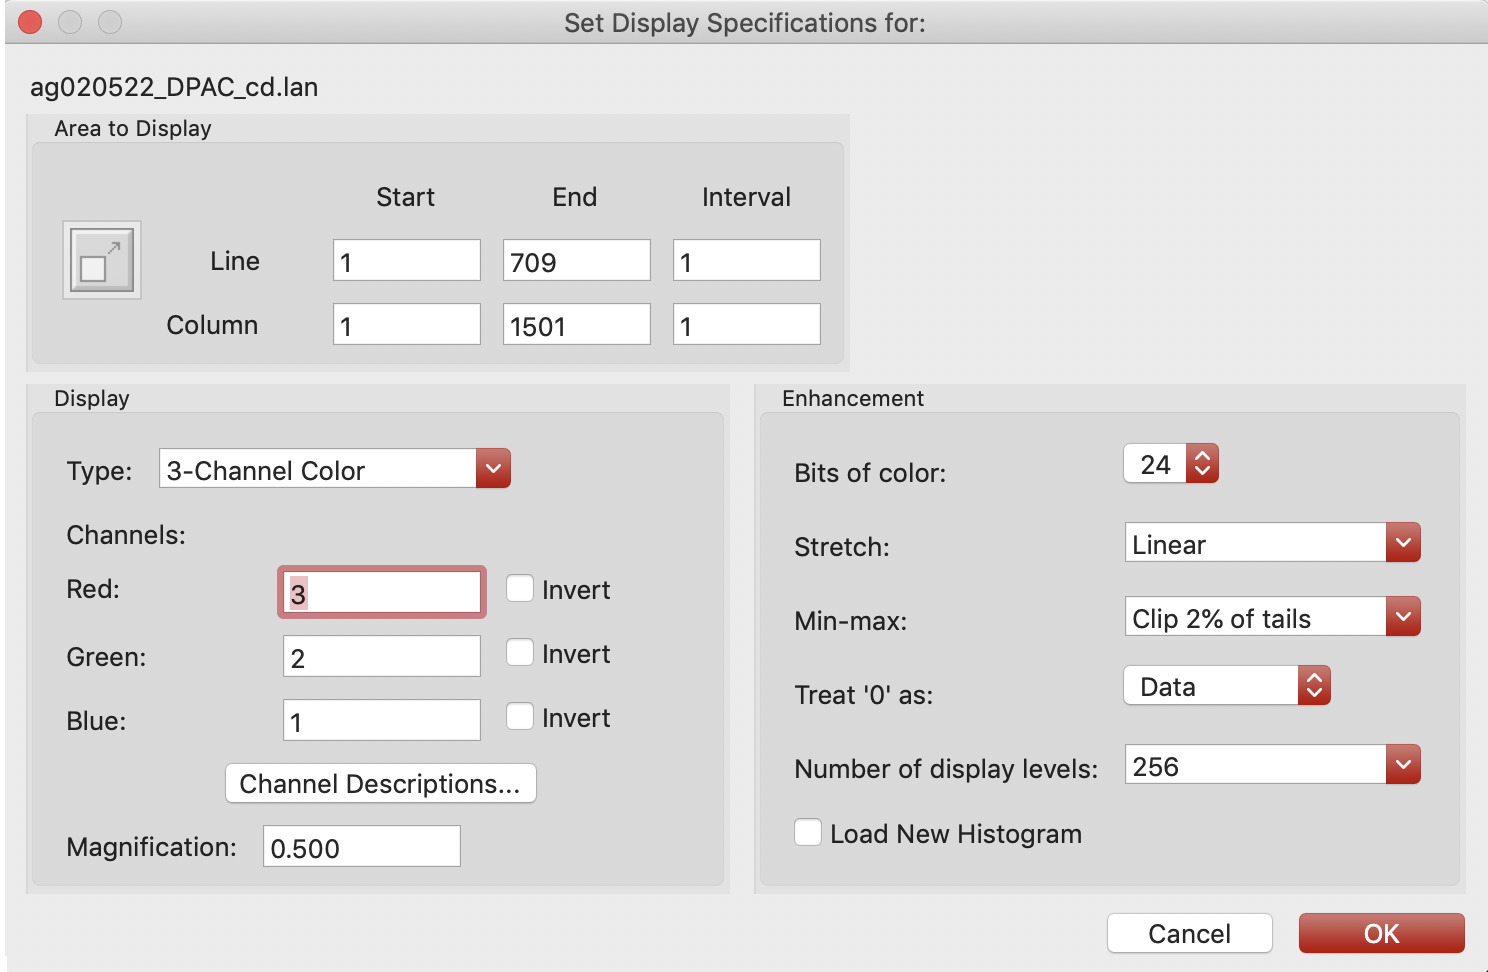
One can control the enhancement of the image in the multispectral image window by setting five different options in the Enhancement portion of the Display Specifications dialog box including Bits of color, Stretch, Min-maxes, Treat ‘0’ as and Display levels per channel.2.1 The “Bits of color” default is 24 and the “Display levels per channel” default is 256 for all monitors now days for the maximum number of colors possible. One can adjust to lower values if one wishes to see what the affects are.
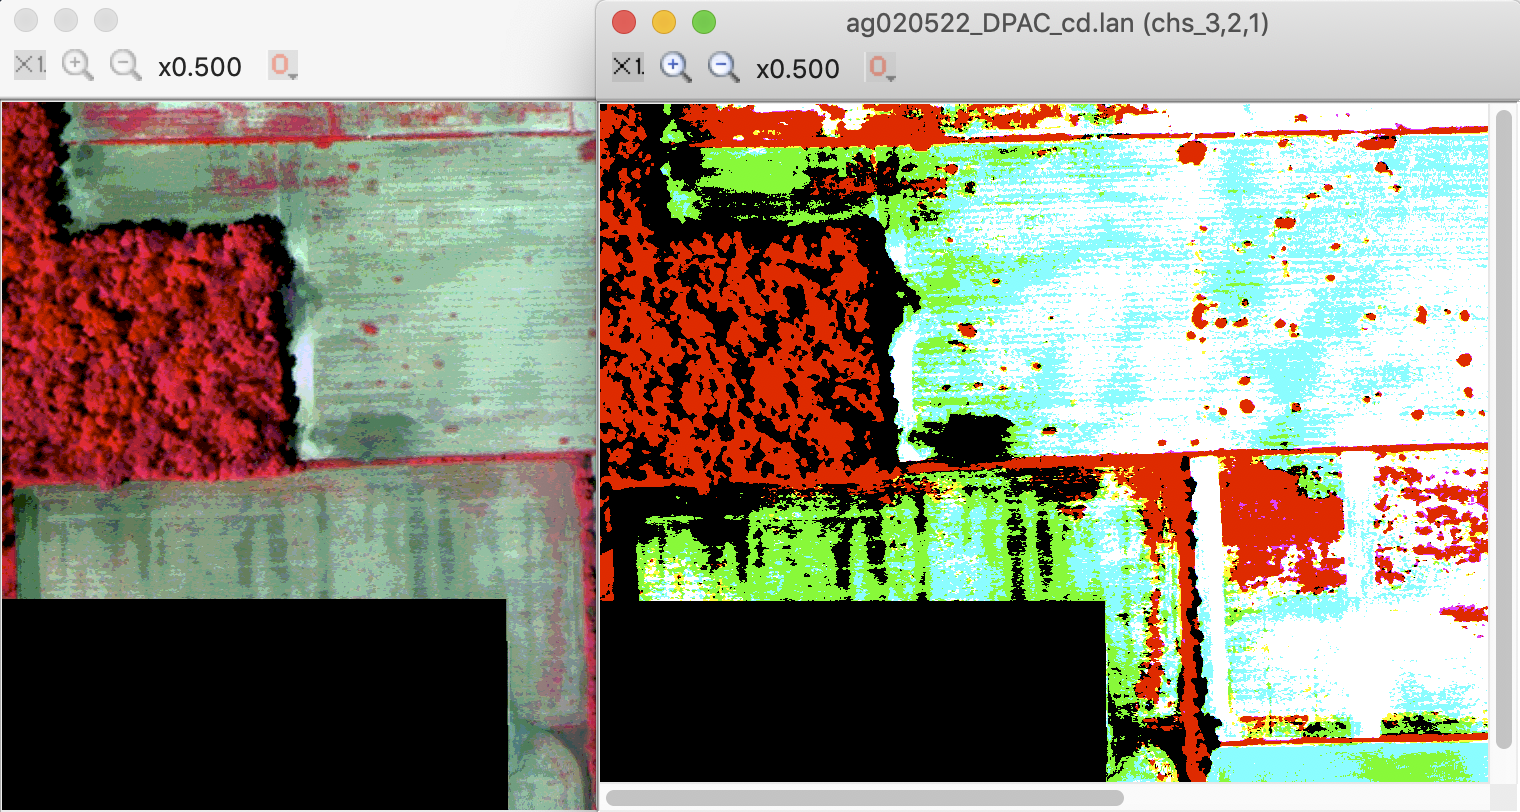
The figure above illustrates 256 display levels per channel (millions of colors) on the left and 2 display levels per channel (8 colors) on the right.
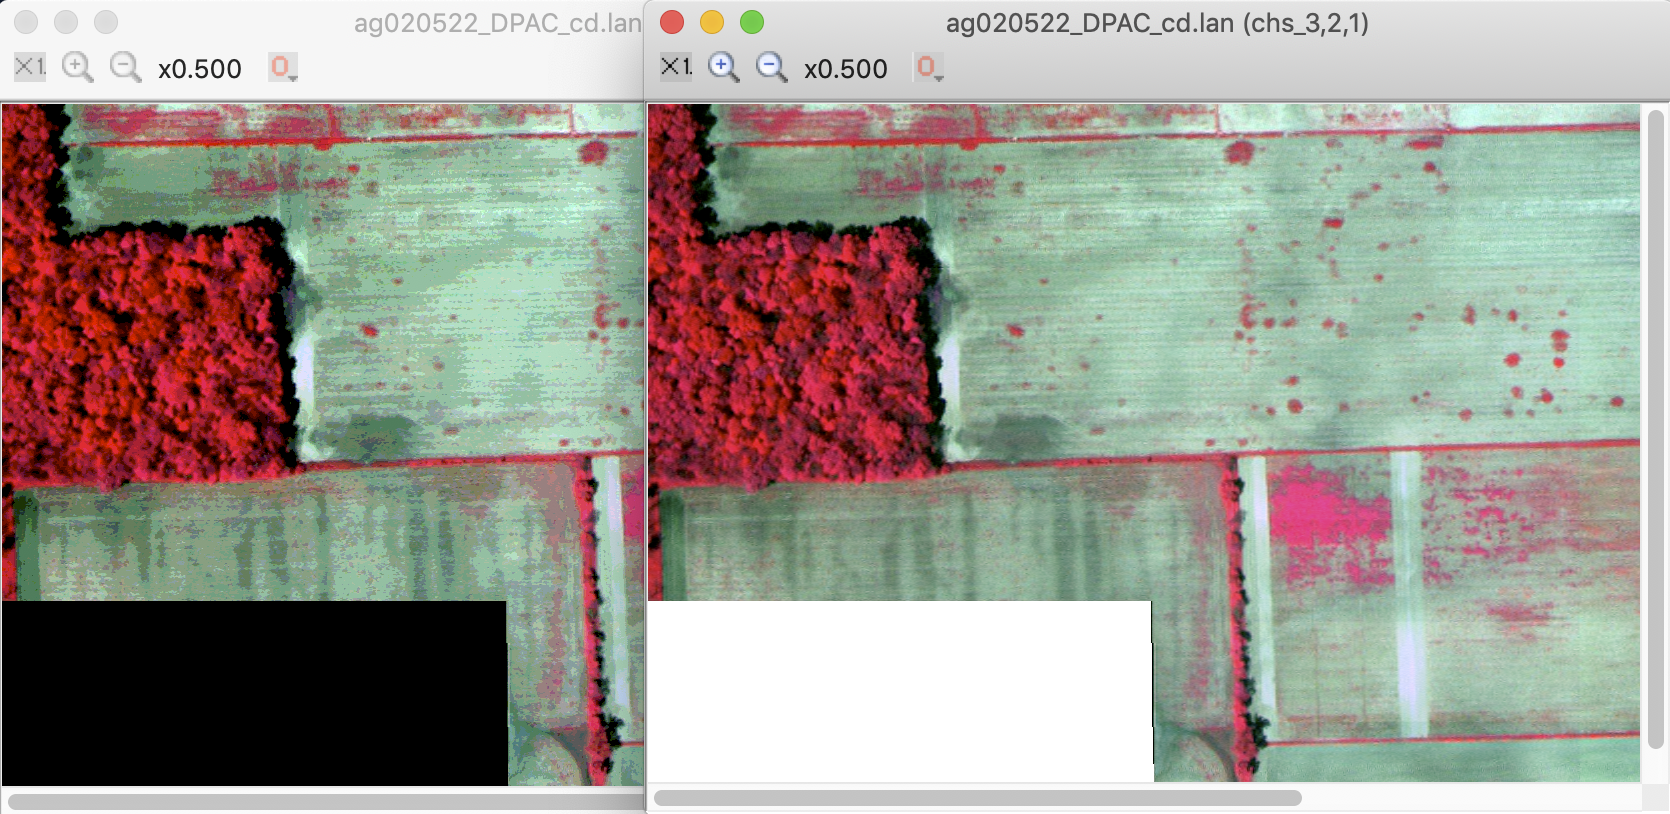
2.2 The Treat ‘0’ as data setting causes 0 values to be displayed as black. However, if 0’s actually represent background or ‘no data’, one may want to select the background option to cause 0’s in all channels to be displayed as white. The figure below illustrates 0’s treated as black on the left and 0’s as white on the right.
2.3 The Stretch and Min-maxes are usually the options used to enhance different parts of the image. They control the process by which each possible data value in the image data is assigned to all possible display levels.
There are three choices for Stretch: Linear, Equal Area and Gaussian. In the case of Linear Stretch, gray scale intervals are equally spaced over the data range, while the Equal Area Stretch choice causes them to be set so that each interval represents about the same number of pixels. Though nonlinear, the equal area stretch will provide maximum contrast. The Gaussian selection causes the distribution of the number of pixels assigned to the gray scale intervals to represent a Gaussian curve. If one holds the 'Option' key down (Mac version) or the 'Right Mouse button down (Windows version) before you select the enhancement popup menu with the left button, you can change the number of standard deviations that the data will be fit to for the Gaussian selection. The default is 2.3.2.4 The Min-maxes option allows one to select the beginning and end data values of the image histogram to be used for assigning the pixels in the gray scale intervals defined by the Stretch option. The “Entire Range” choice for this option would cause lowest data value possible in the image, 0 for 8-bit unsigned data, to be the first data value displayed for lowest display value (black) and 255 to be the last data value displayed for the highest display value (white). However, if the actual range of the data is only 50 to 150, then the data will only be represented by grays not black to white; there will not be much contrast in the image.
The 2 Percent Tails Clipped choice will cause the selected begin and end range of data values for a given channel to represent those data values in which 2 percent of them in the histogram are outside of the selected range. The intent of this choice is to reduce the chance that a small number of extreme outlier data values in the image will unduly influence the display enhancement. This choice usually results in a display of the data that has better contrast over all.
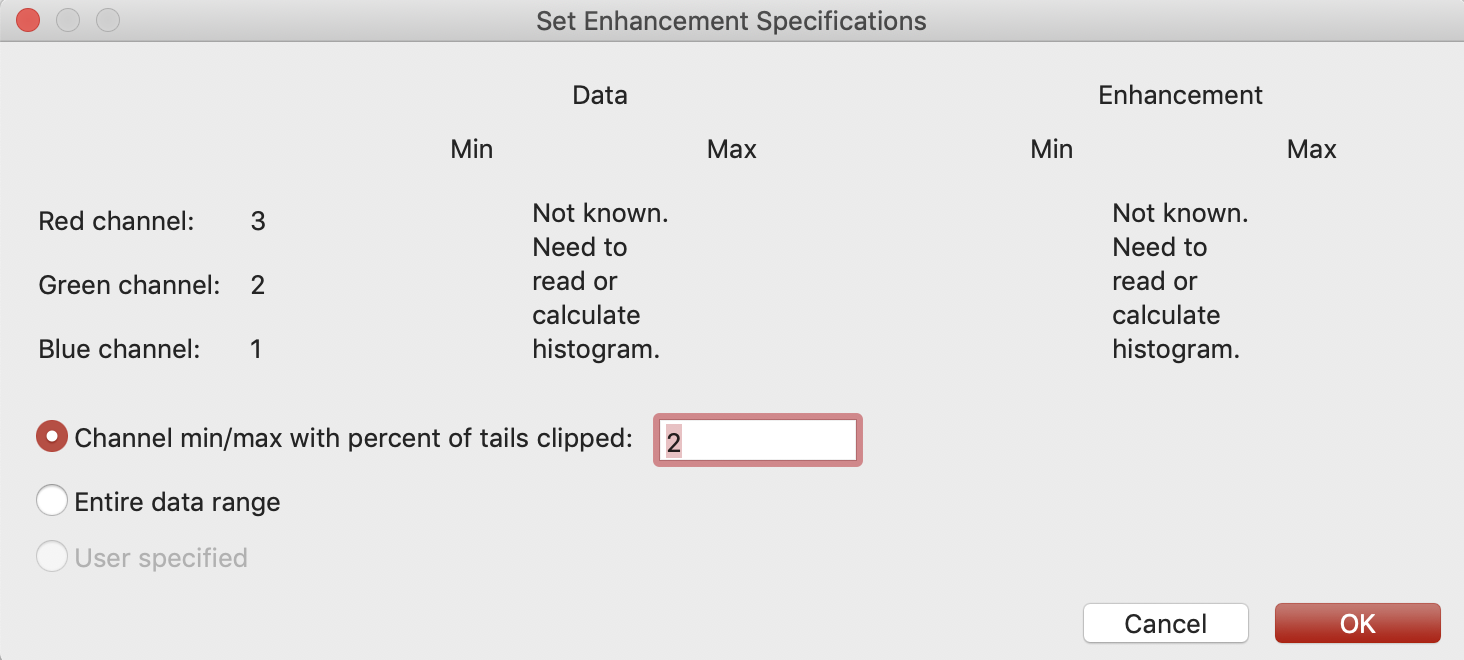
Selection of the Specify Min-Max... choice presents a dialog box (illustrated below) to allow one to set percent of tails clipped to be something other than 2%. You can also set your own min-max values to stretch the gray levels across. The actual data min and max values computed from the histogram are included in the dialog box.
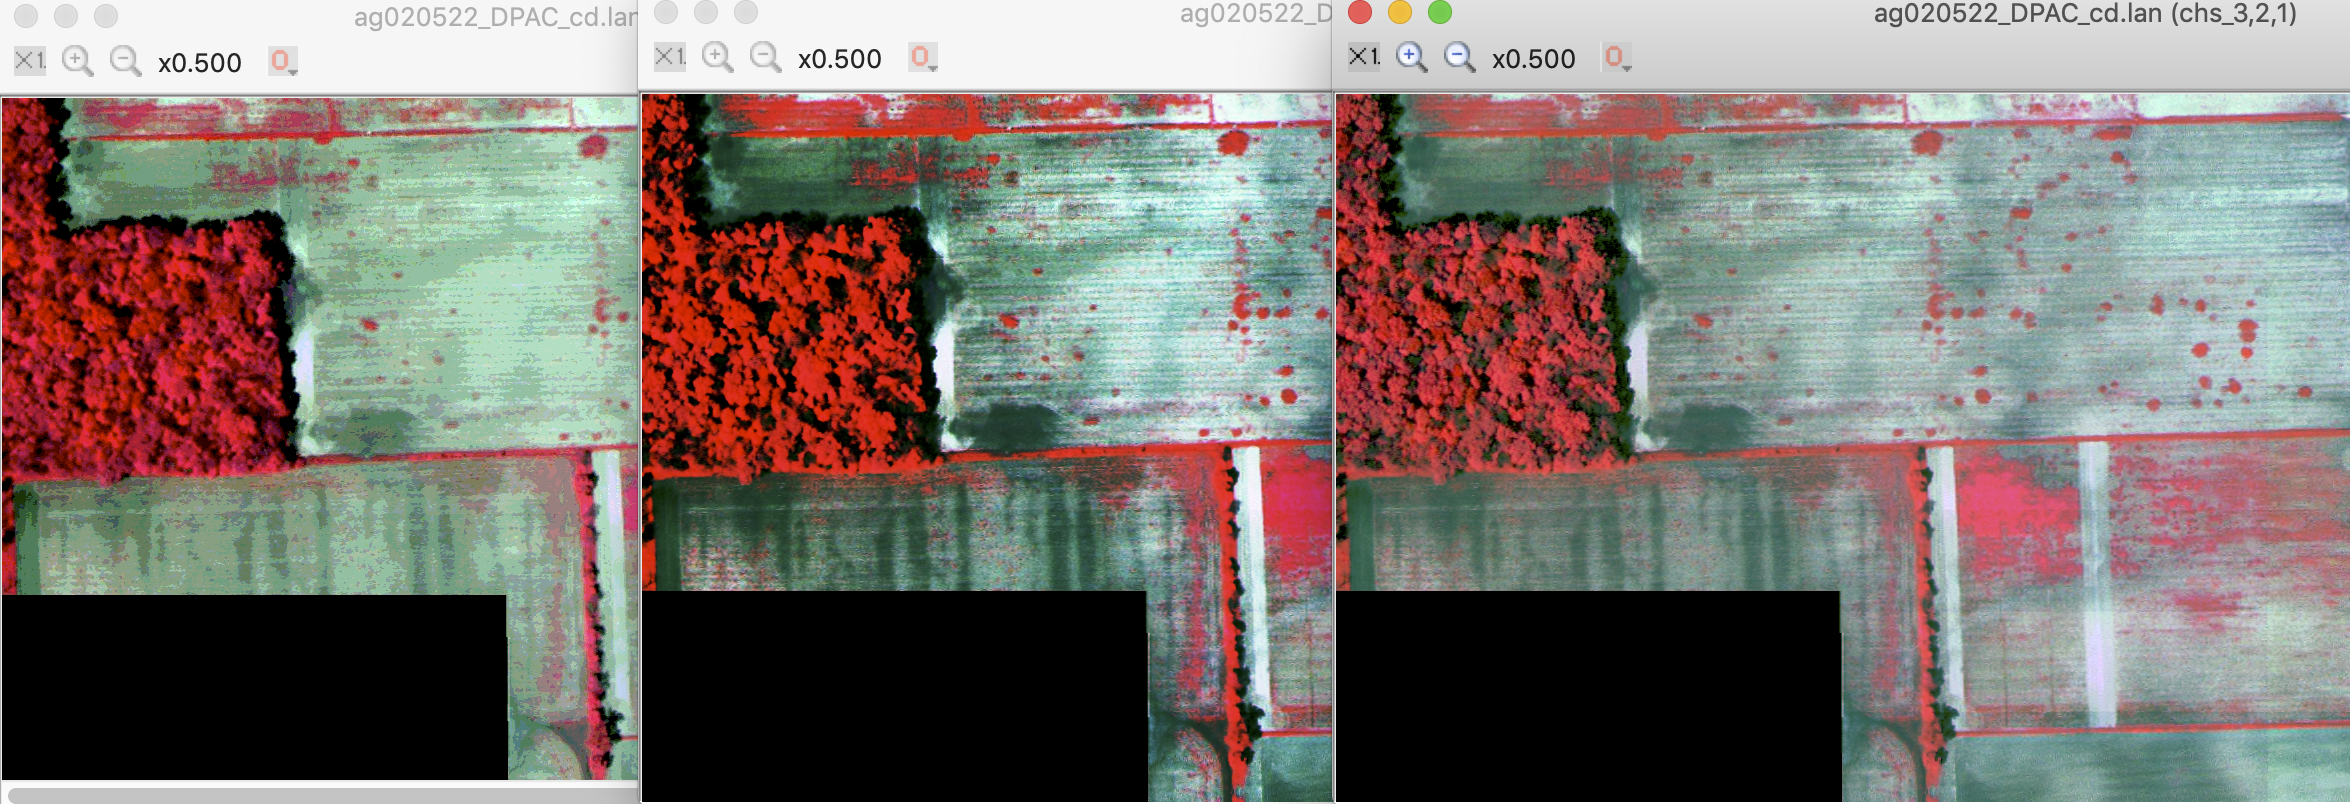
Linear, equal area and Gaussian stretches are illustrated in figure above left to right.
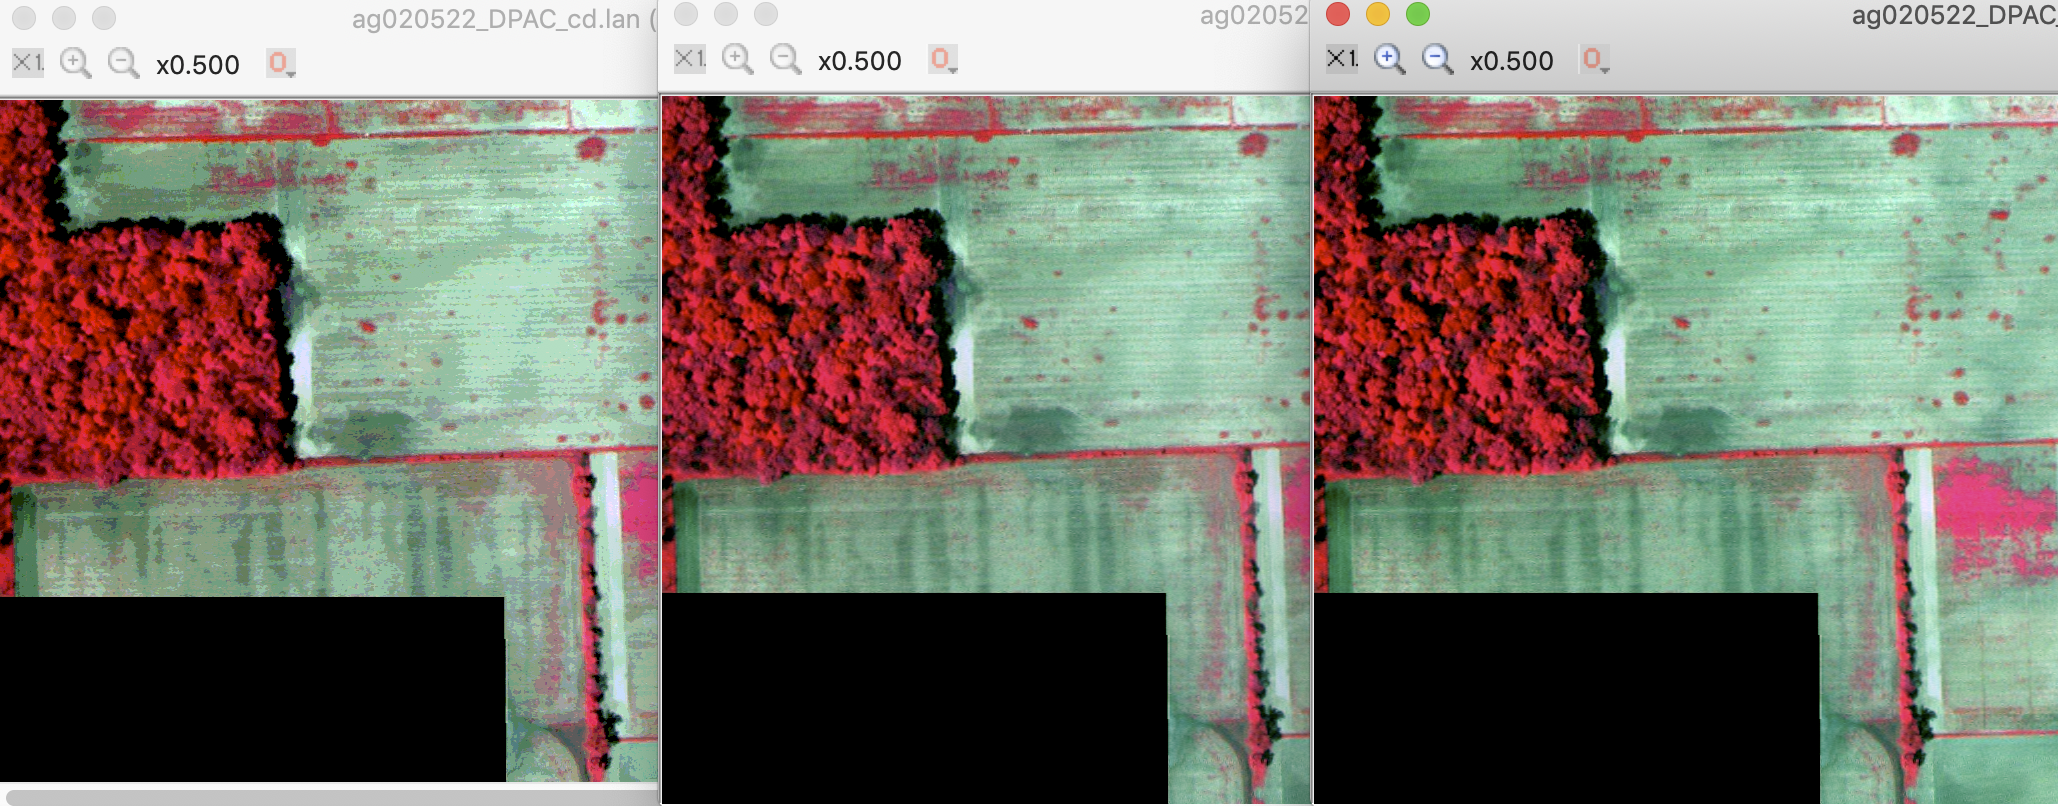
Entire range, 2% clip and 4% clip is illustrated below from left to right.
Continue to next tutorial.